Building a Shopify sales analytics dashboard
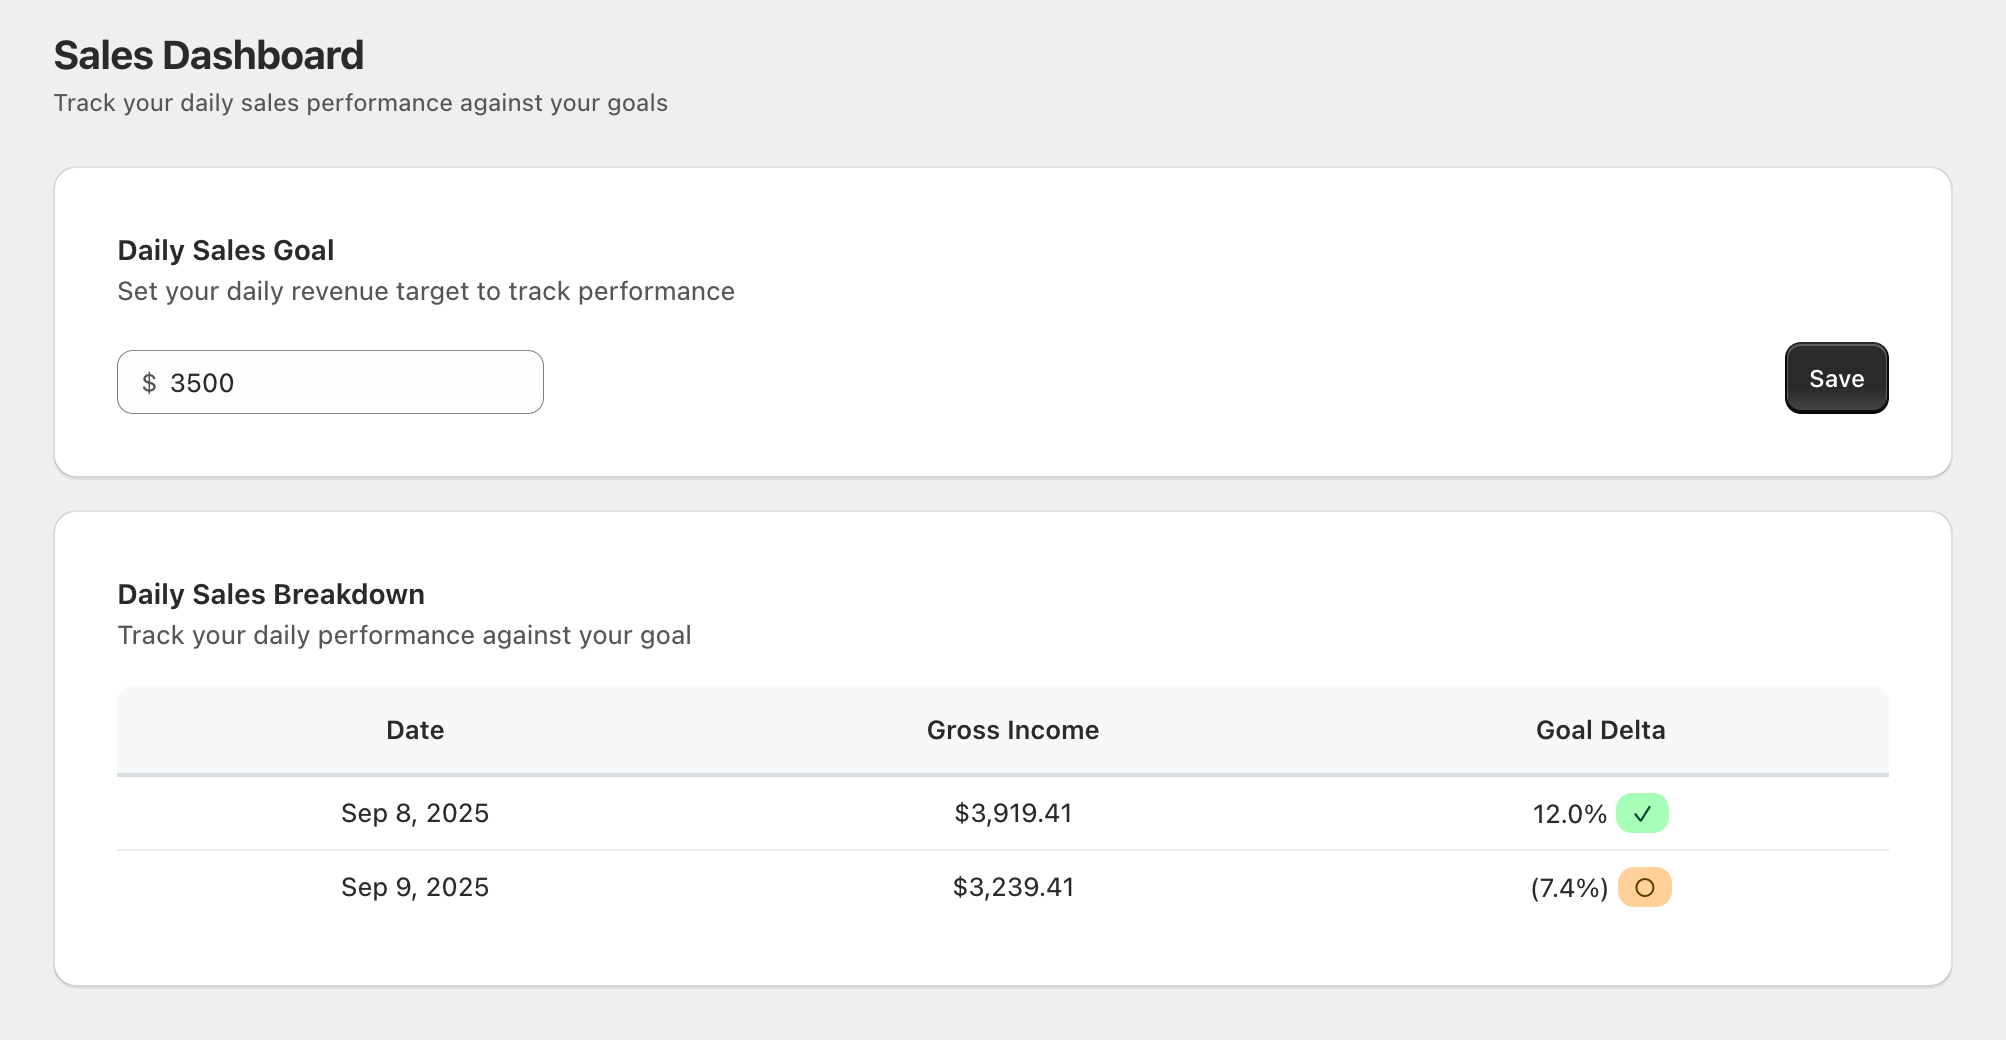
I recently built a Shopify app that helps merchants track their daily sales performance against a custom daily sales goal. Using Gadget's full-stack platform, I was able to create a simple yet powerful analytics dashboard with minimal code.

Here's how I did it.
Requirements
- A Shopify Partner account
- A Shopify development store
What the app does
The app provides merchants with:
- A sales dashboard showing daily income breakdown
- Daily sales goal setting and tracking
- Visual indicators showing performance against goals
- Automatic data synchronization from Shopify orders and transactions
Building a sales tracker
Gadget will take care of all Shopify’s boilerplate, like OAuth, webhook subscriptions, frontend session token management, and has a built in data sync that handles Shopify’s rate limits.
This is all on top of Gadget’s managed infrastructure: a Postgres db, a serverless Node backend, a built-in background job system built on top of Temporal, and, in my case, a Remix frontend powered by Vite.
Let’s start building!
Create a Gadget app and connect to Shopify
- Go to gadget.new and create a new Shopify app. Keep the Remix and Typescript defaults.
- Connect to Shopify and add:
- The <inline-code>read_orders<inline-code> scope
- The <inline-code>Order Transactions<inline-code> model (which will auto-select the Order parent model as well)
- Fill out the protected customer data access form on the Shopify Partner dashboard. Make sure to fill out all the optional fields.
- Add a <inline-code>dailyGoal<inline-code> field to your shopifyShop model. Set its type to <inline-code>number<inline-code>. This will be used to track the sales goal the store aims to achieve.
- Add an API endpoint trigger to the <inline-code>shopifyShop.update<inline-code> action so merchants can update the goal from the frontend. Shopify merchants already have access to this action, which will be used to update this value in the admin frontend, so we don’t need to update the access control settings.
- Update the <inline-code>shopifyShop.install<inline-code> action. Calling <inline-code>api.shopifySync.run<inline-code> will kick off a data sync, and pull the required Shopify order data automatically when you install your app on a shop:
If you've already installed your app on a Shopify store, you can run a data sync by clicking on Installs in Gadget, then Sync recent data. This will pull in data for the 10 most recently updated orders from Shopify, into your Gadget db.
Adding a view to aggregate sales data
We can use a computed view to aggregate and group the store’s sales data by day. Computed views are great because they push this aggregation work down to the database (as opposed to manually paginating and aggregating my data in my backend). Views are written in Gelly, Gadget’s data access language, which is compiled down to performant SQL and run against the Postgres db.
- Add a new view at <inline-code>api/views/salesBreakdown.gelly<inline-code> to track the gross income of the store:
This view returns data aggregated by date that will be used to power the dashboard. It returns data in this format:
Our backend work is done!
Building a dashboard
Time to update the app’s frontend to add a form for setting a daily goal and a table for displaying current and historical sales and how they measure up against the goal!
Our Remix frontend is already set up and embedded in the Shopify admin. All I need to do is load the required data and add the frontend components to power my simple sales tracker dashboard.
- Update the <inline-code>web/route/_app._index.tsx<inline-code> file with the following:
The dashboard: React with Polaris
Here’s a quick breakdown of some of the individual sections in the dashboard.
Server-side rendering (SSR)
The app uses Remix for server-side data loading. It determines the date range for the current month and calls the view using <inline-code>context.api.salesBreakdown<inline-code>. Results are returned as <inline-code>loaderData<inline-code> for the route:
Form for setting a daily sales goal
A Gadget <inline-code>AutoForm<inline-code> is used to build a form and update the <inline-code>dailyGoal<inline-code> when it is submitted.
With autocomponents, you can quickly build expressive forms and tables without manually building the widgets from scratch:
Data visualization
The dashboard uses a Polaris <inline-code>DataTable<inline-code> to display the results:
Sales performance tracking
The app calculates goal achievement and displays visual indicators, which are then displayed in the above table:
And that’s it! You should have a simple sales tracker that allows you to compare daily sales in the current month to a set daily goal.
Extend this app
This is a very simple version of this app. You can extend it by adding:
- Slack or SMS integration that fires once the daily goal has been met (or missed!).
- Custom daily goals per day or per day of the week.
- Historical data reporting for past months.
Have questions? Reach out to us on our developer Discord.


