Gadget’s BFCM 2025 (in numbers)

Black Friday Cyber Monday (BFCM) remains the annual stress test for Shopify and BigCommerce apps, and this year pushed ecommerce traffic higher than anything we (or Shopify) have seen before!
Below is a recap of how Gadget apps performed, compared against traffic from a "normal" weekend earlier in the year.
Total webhooks processed
Gadget processed 173,078,683 webhooks over the BFCM 2025 weekend, which works out to an average rate of 30,048.382 webhooks/minute!


For context:
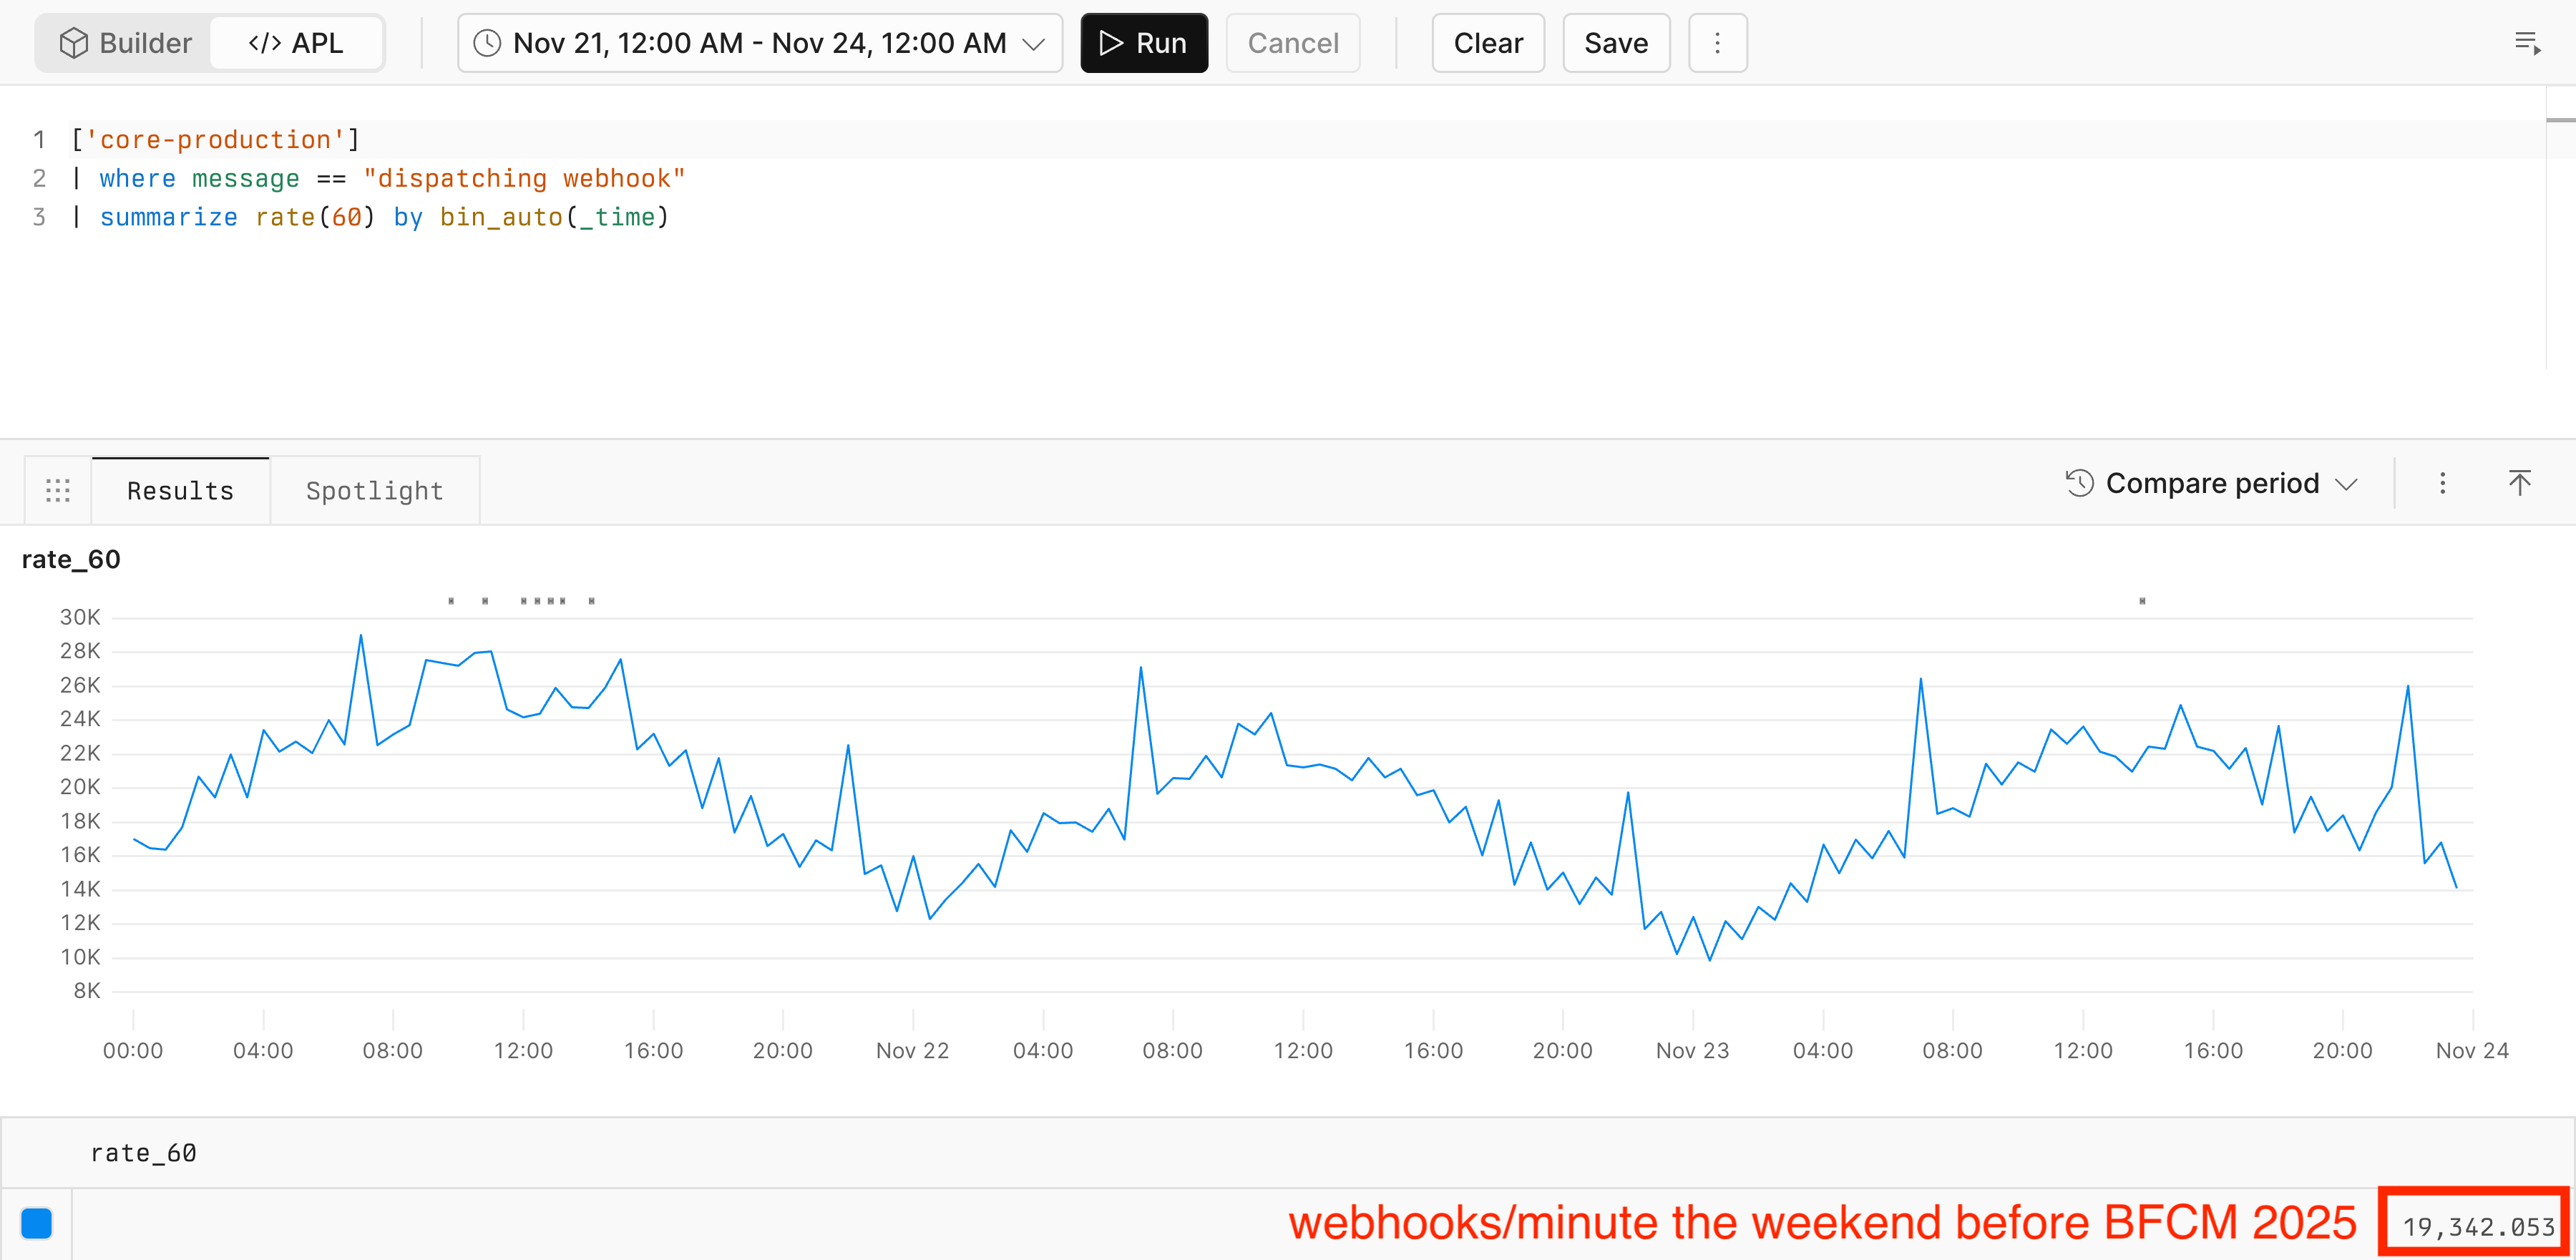
- Last weekend (Nov 21-24), we processed 83,557,668 webhooks, or 19,342.053 webhooks/minute.

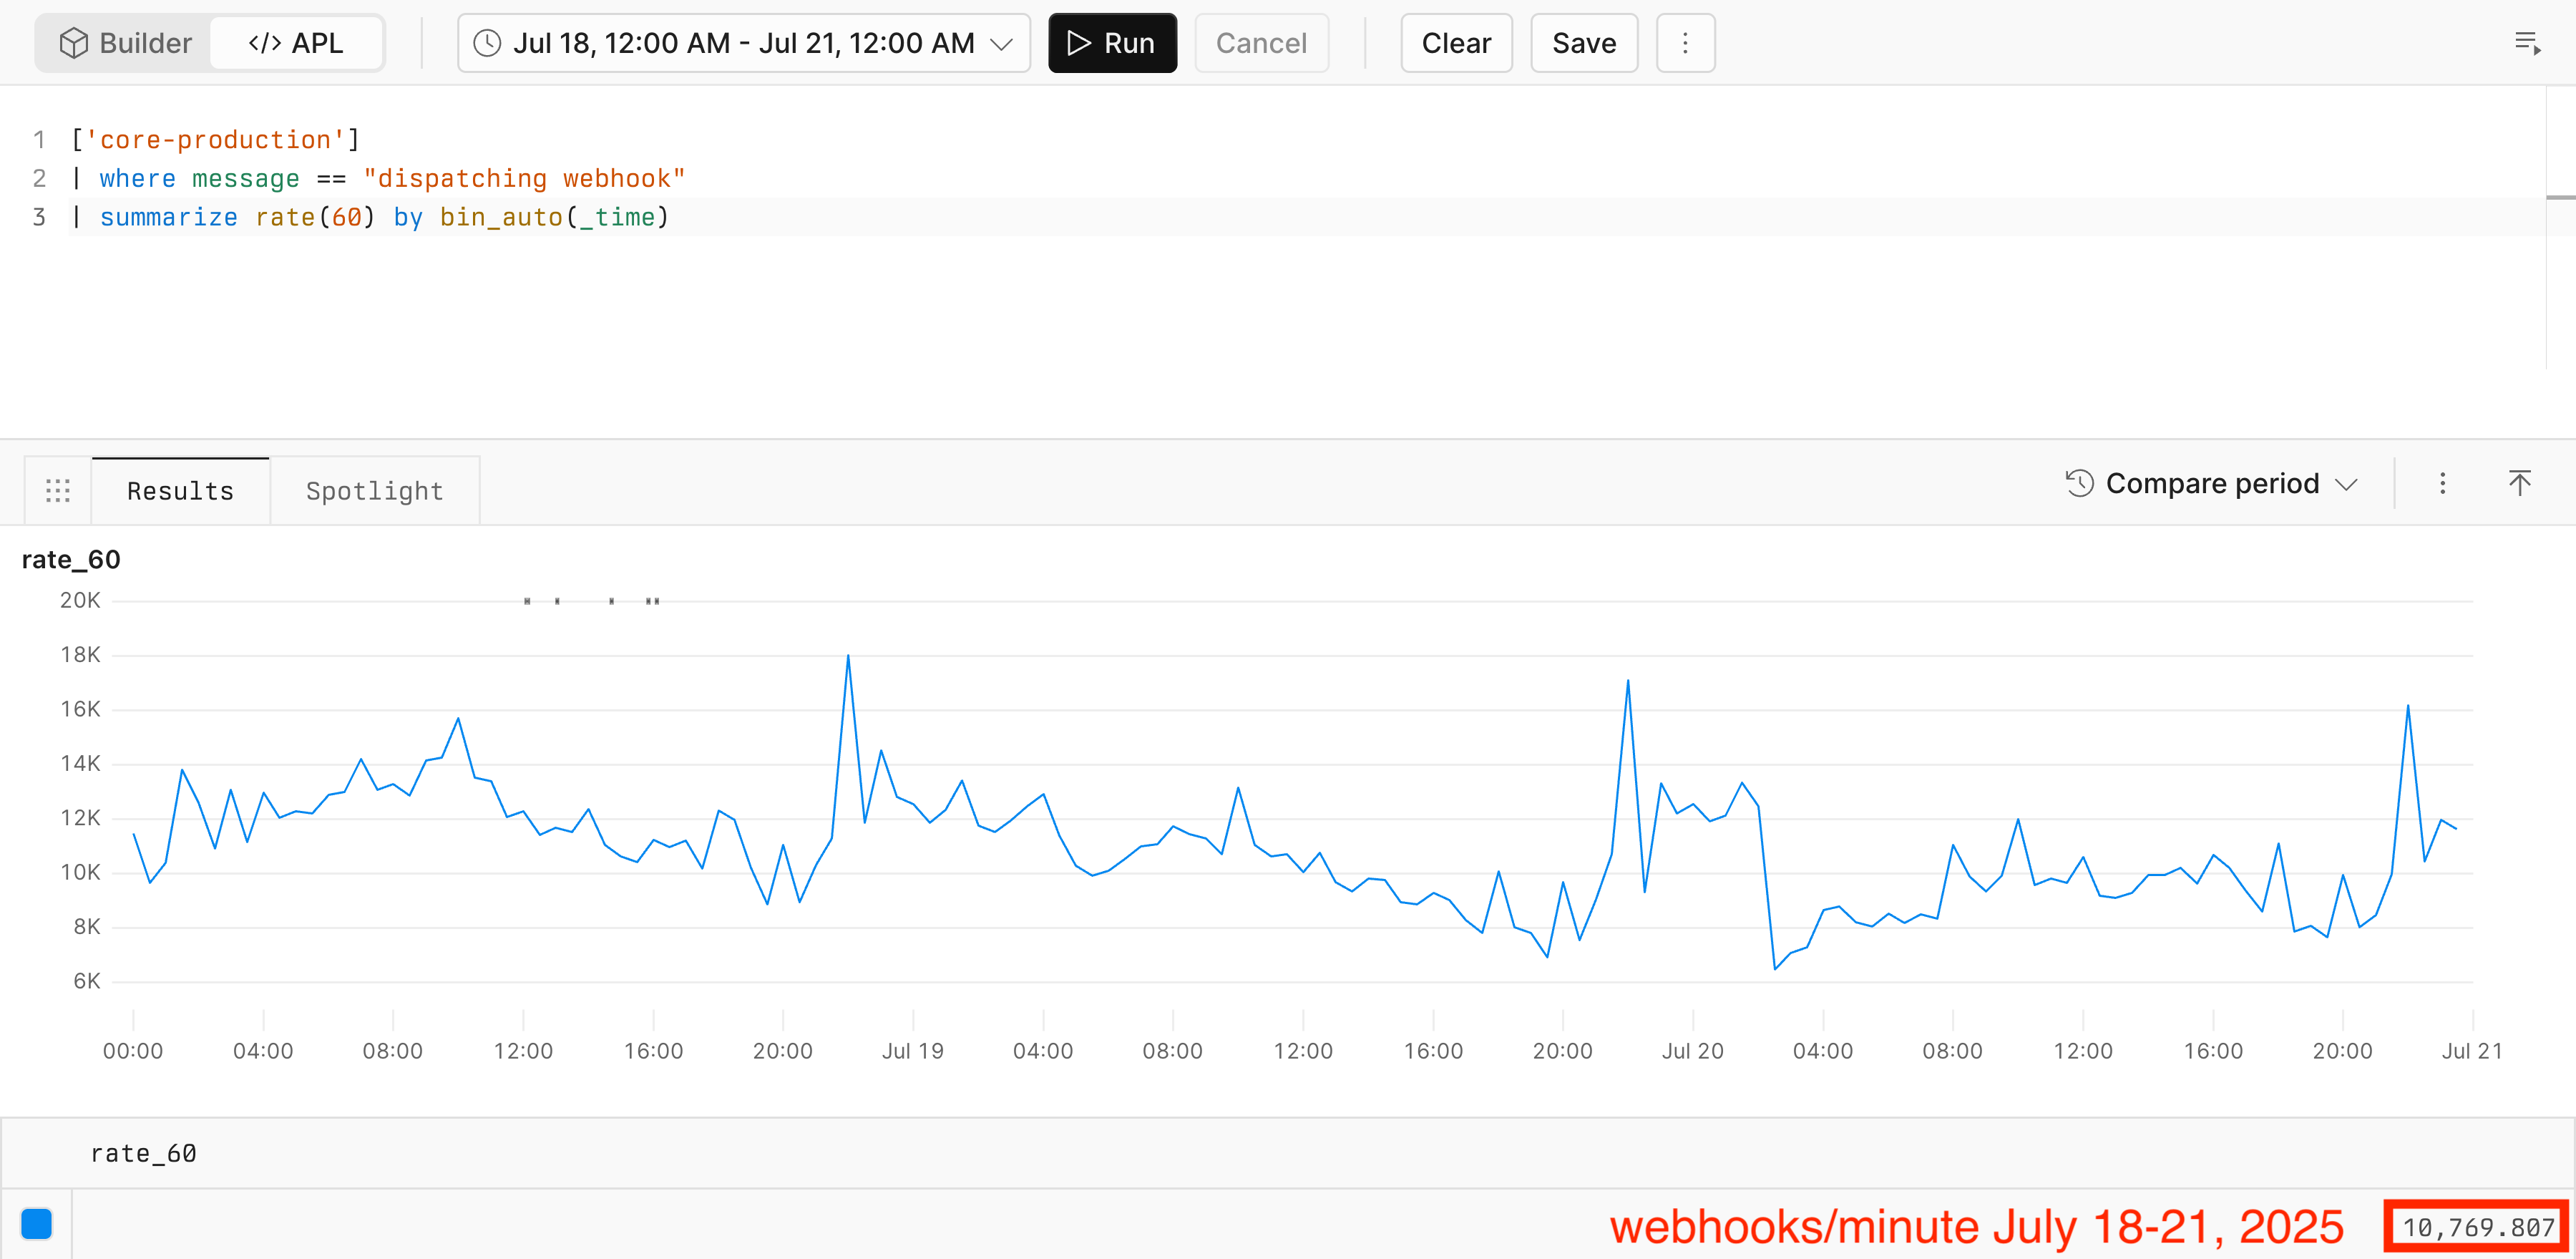
- Picking a random weekend earlier in the year, July 18-21, we processed 46,525,567 webhooks, or 10,769.807 webhooks/minute.

This shows how "spikey" BFCM traffic is and highlights the scaling needed for ecommerce apps. Webhooks per minute tripled during BFCM when compared to a weekend in July, and applications need to be built to handle this massive increase in load. And assuming that you actually do something with the webhook payload, the rest of your app stack also needs to scale to meet traffic demands.
Orders, orders, orders
Shopify’s <inline-code>orders/create<inline-code> webhook gives us a rough idea of how many new orders were modified or customized using Gadget apps.
Over BFCM, the average rate of <inline-code>orders/create<inline-code> webhooks processed by Gadget per minute was 970.358!
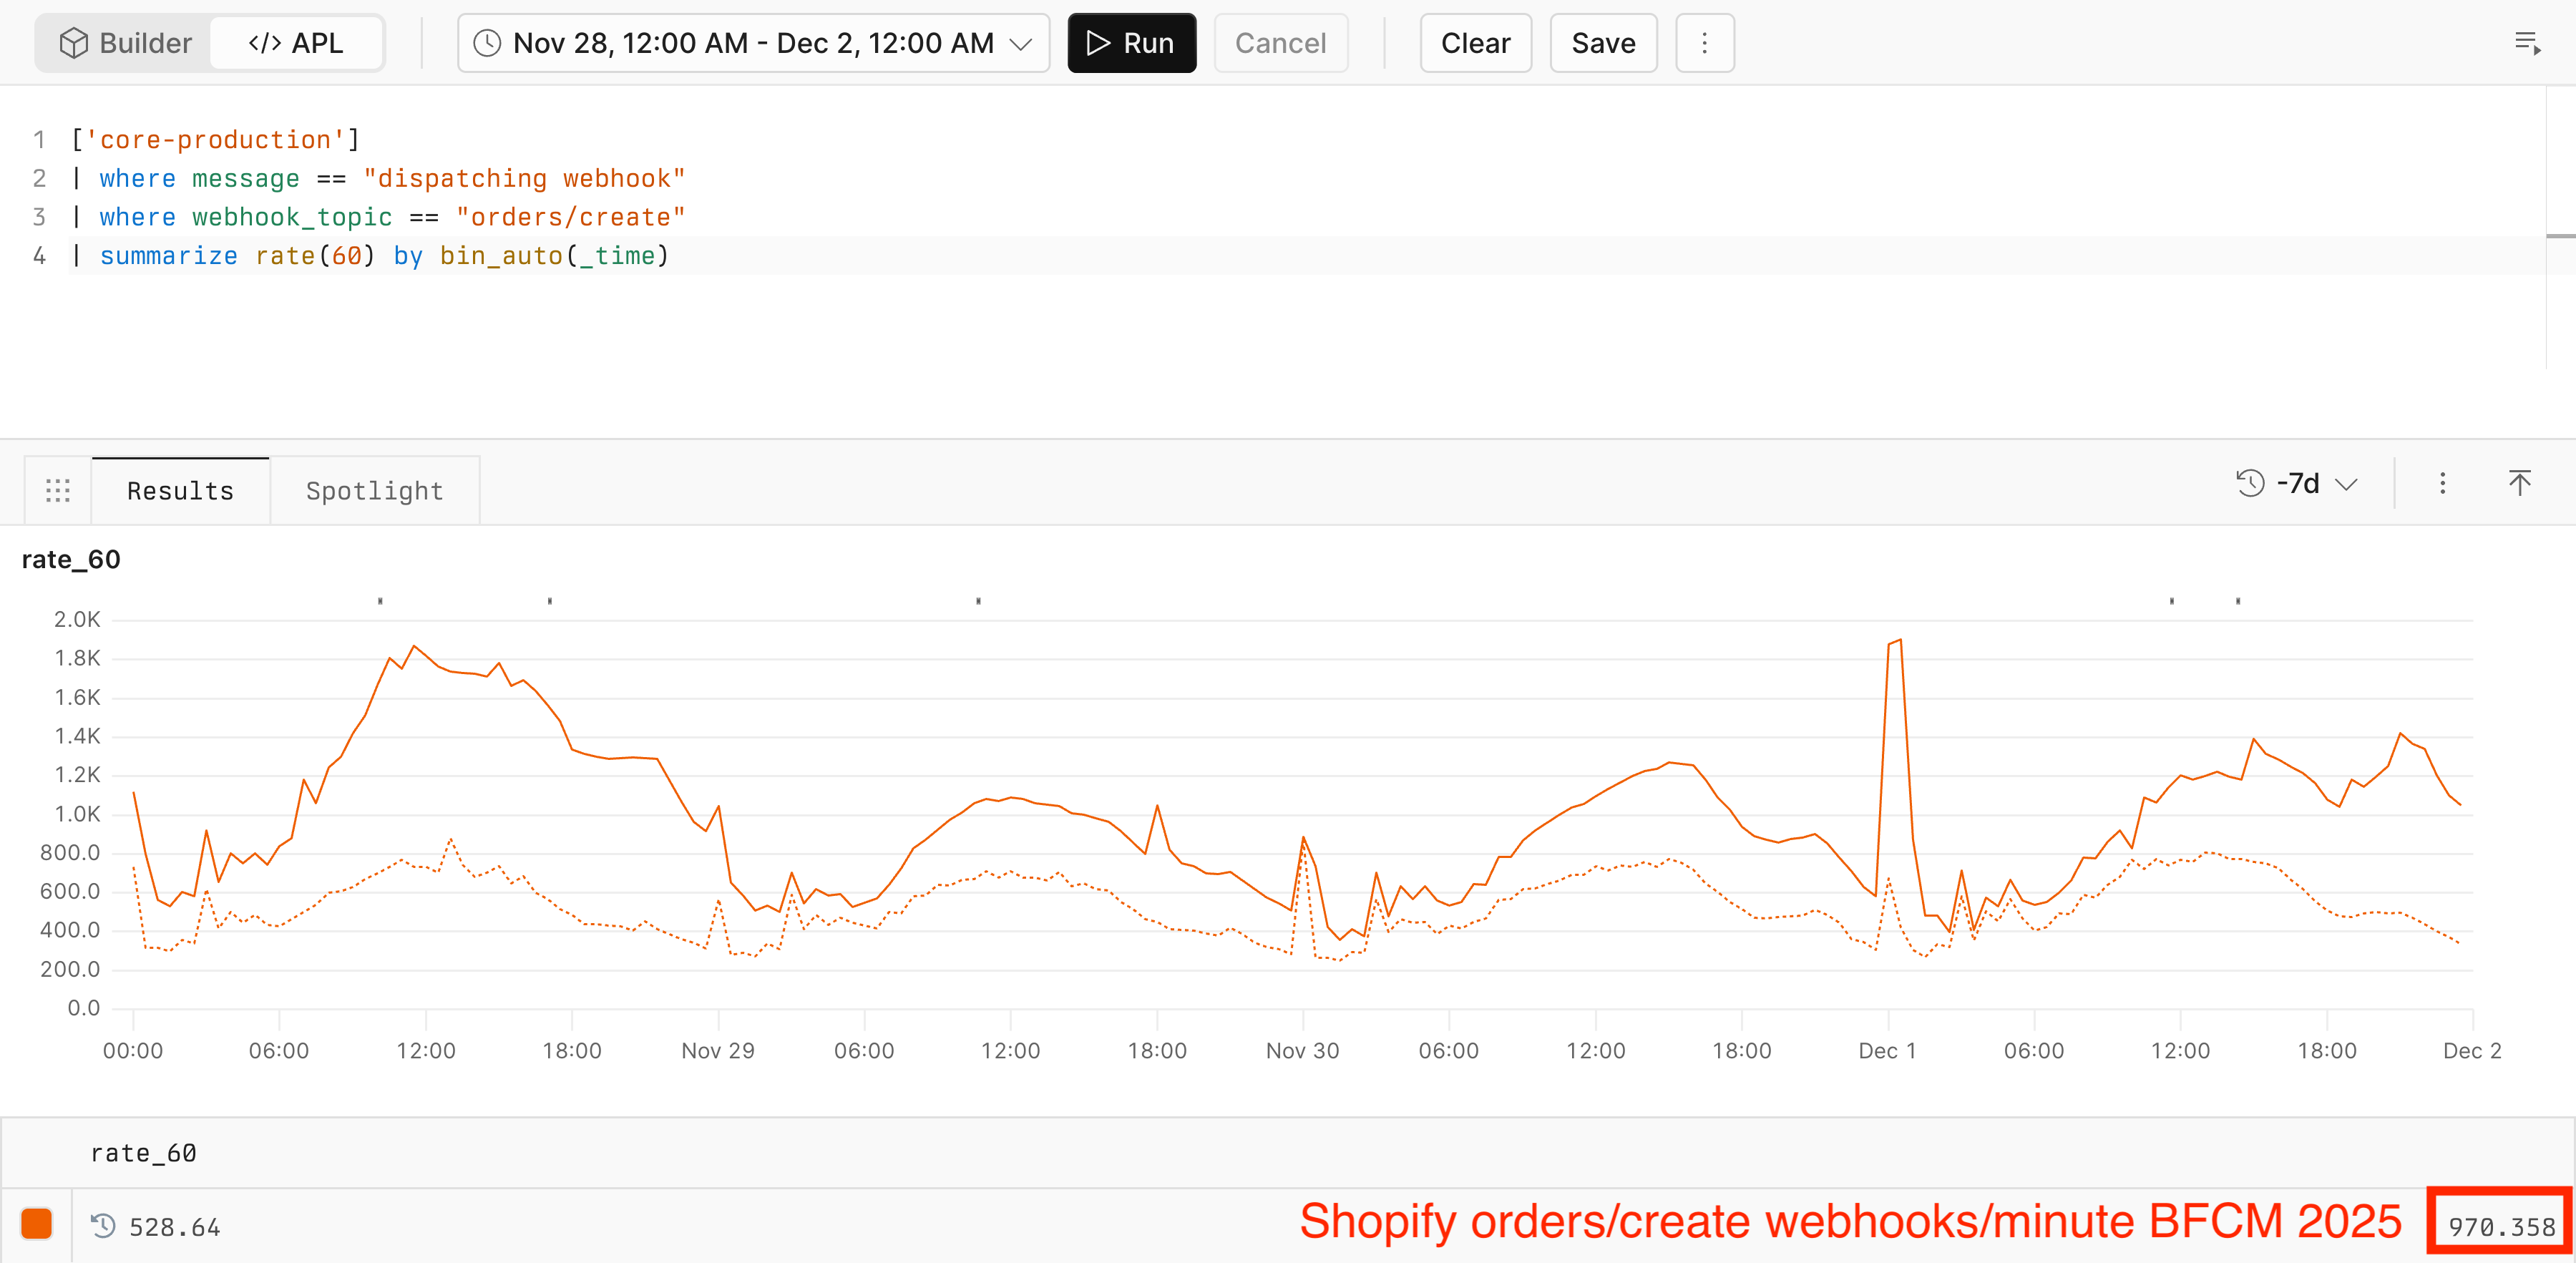
That’s compared to ~530 <inline-code>orders/create<inline-code> webhooks/minute the previous weekend!
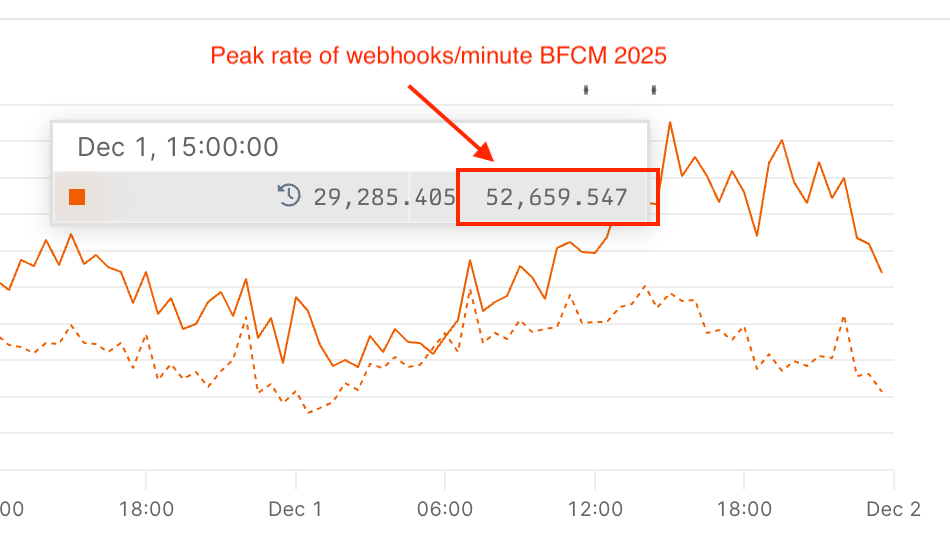
Peak webhook rate
This year’s highest sustained traffic reached 52,659.547 webhooks/minute around 15:00 UTC (or 10:00 am ET) on Cyber Monday. The load curve showed a clean ramp, a stable peak throughout the day, and a slow taper as Cyber Monday deals wound down.
Weekend spike compared to pre-BFCM traffic
To get an idea of how much of an increase in webhook traffic we see over BFCM, we can take a look at the biggest difference in webhooks/minute rates across BFCM and the weekend prior.
The largest rate difference was 31,619.900 additional webhooks/minute compared to the same minute the prior weekend (50,106.888 webhooks/minute during BFCM vs 18,486.988 webhooks/minute the weekend before BFCM), which is a spot increase of 171%!

You know apps are more than just webhooks, right?
Webhooks are a good measure of our BFCM traffic, but there are some additional DB throughput stats we can share!
Over the BFCM weekend, the Gadget platform handled:
- 1.4 billion DB queries
- 2628 TB of reads (yes, that is over 2.5 PB!)
- 1.3 TB of writes
Congratulations again to all ecommerce developers for surviving yet another BFCM weekend!
A special shoutout to the Gadget infrastructure team, who spend weeks (and months) prior to BFCM scaling up resources and redefining architecture to handle the increase in traffic over this important retail weekend!
We look forward to scaling up again next year!