We set out to save money on observability. Instead, we (accidentally) rebuilt our incident response workflow.

This post was supposed to be about how we migrated Gadget’s observability stack from Axiom to ClickHouse and Grafana, and saved a bunch of money. We did that, but the big story is actually how the collection of agent skills we built to help us with this migration ended up fundamentally transforming how we approach incident response and production debugging at Gadget.
So we will still talk a bit about the migration, what the process looked like and some of the tools we used, but what we really want to share is how agents have become our primary mechanism for incident response.
Over the course of a couple of weeks, we went from manually searching through logs and traces and dashboards, to delegating these investigatory tasks to Claude. And it’s all thanks to the agent skills and MCP server we built to help us with our migration.
I use the dashboards way less and do zero log searching myself; it's all Claude. We learned how to use ClickHouse well, wrote the skill, and then stopped thinking about it.
In a way, learning how to use ClickHouse for infra/observability/operations wasn't useful because it enables data visualization with dashboards. It was useful because it let us set guardrails for our MCP server and ClickHouse skill.
- Kirin Rastogi, Infrastructure Engineer @ Gadget
(And to be clear, we did save money. The entire migration took about a week and was finished 1.5 weeks ahead of schedule. Our monthly observability bill dropped from ~$20k to ~$8k.)
Observe our observability
Gadget is a platform for full-stack web apps, providing developers with hosted development and production environments and APIs to “summon” infrastructure as needed. Our infrastructure and platform powers thousands of ecommerce and web apps, which means we, Gadget’s infra team, need our observability dial turned up all the way to 11.
We are heavily biased towards log-based alerting, which means we need to search and aggregate log entries and trace spans for our dashboards. We use Prometheus-style metrics for our infrastructure in GCP, but we are log-centric when it comes to application monitoring, which might be a bit different from metrics-based observability commonly used by other infra teams.
(We are not log-based because we are a team of beavers based in Ottawa, Canada, a common misconception. This setup is largely an artifact of early decisions and technical debt. Log-based observability is dead simple to set up, and we’ve built alerts based on detecting “needle in the haystack” events across our platform. When Kirin joined the Gadget team, he had one question: “How do you live like this?”
We’re working on it.)
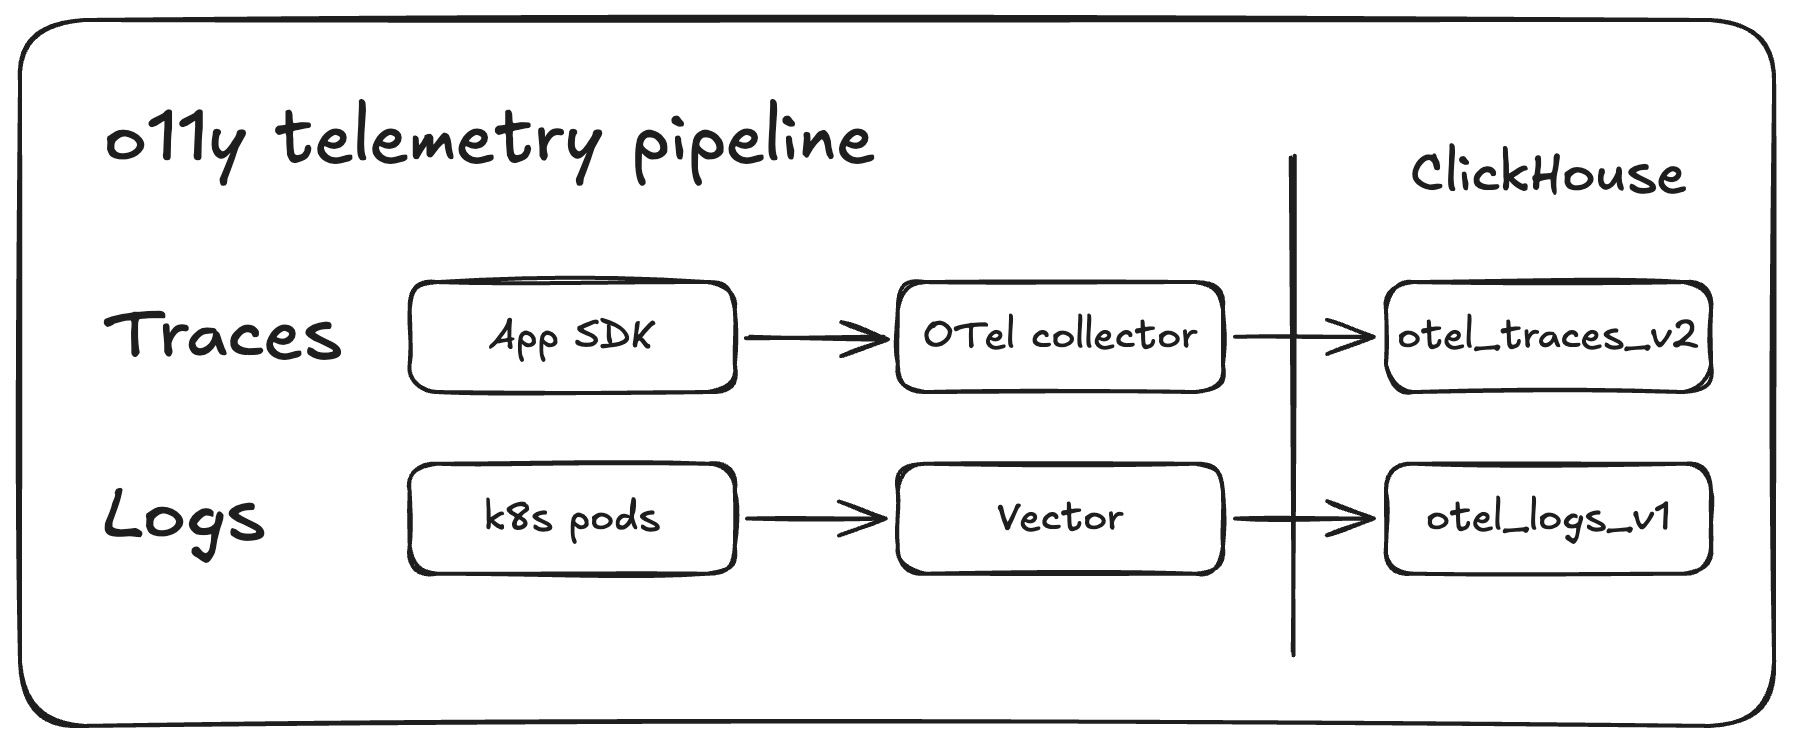
Traces are handled by our OTel collector. k8s pod logs flow through Vector and make use of custom VRL (Vector Remap Language) scripts that transform our raw container output into OTel-formatted ClickHouse rows.
Once more, with agents
Our observability stack now includes agent skills and rule files. These skills were initially built to assist with the migration from Axoim to Clickhouse and Grafana, and now they power incident response. Claude loads the ClickHouse skill, queries logs and traces via MCP, and runs through an RCA playbook. All the same tooling that was built to migrate dashboards is now the first thing engineers reach for when something breaks.
Instead of manually digging through dashboards, agents are our first entry point to incident investigation. Dashboards are primarily used for secondary validation and to power our alerts.
We didn’t set out to do this, but our agent skills have massively reduced incident response times. RCA investigations have gone from taking days to hours, and from weeks to days for more complex issues. Plus any member of the team can investigate any issue and actually come up with useful and actionable ideas and results; there is way less “Who built this?” and way more “Here’s how we can fix this.” Now Andy can dig into skipper controller assignments even though skipper is Scott’s baby.
(skipper is Gadget’s Kubernetes-based sandbox orchestrator: it assigns tenant-specific app workloads to sandbox pods, routes requests to the right instance, and scales pods up or down as demand changes. In our infra stack, it sits between the platform API and the user’s sandbox runtime, giving us per-tenant isolation with efficient pod reuse.)
We’ll talk more about how and why we built these skills later. Let’s quickly chat about the migration from Axoim.
It’s not you, it’s me
We had a flippin’ great deal on Axoim for the past 3 years. We liked using it: APL, their query language, made exploration easy compared to raw SQL, and the Axoim team worked with us to optimize our queries over large time windows.
But our monthly bill was about to increase from ~$20K to $25-30K a month. We also needed to build an observability dashboard for our users which would further increase our costs if we stuck with Axoim.
So we decided to migrate to ClickHouse, which could also power our in-platform observability dashboard for users, and Grafana.
Why Grafana and ClickHouse?
Because everyone uses Grafana, and everyone can’t be wrong. (But actually. Also, it does make it easier for new Gadget employees to onboard.)
We already use Grafana to monitor Kubernetes test failures in CI, and we use it via <inline-code>pgwatch<inline-code> for PostgreSQL monitoring. Most of the Gadget team is ex-Shopify or ex-Stripe, and both companies use Grafana. It is our cozy, familiar observability blanket. Our “observabili-blanket”. We know how to use it, agents know how to configure it, and there is plenty of material available to figure out what we don’t already know.
There is a small penalty for choosing Grafana: its customizability comes at the expense of setting it up yourself. Thankfully, Claude was a massive help there. More on that later.
We had no prior experience with ClickHouse, but we knew that column storage made it well-suited for logs and traces, plus ClickHouse is extremely compressable so we could optimize our storage costs.
We ultimately chose ClickHouse’s hosted solution: clickhouse.cloud. They manage the infrastructure; we control the schema. This PaaS approach gave us the operational benefits we needed without managing storage clusters ourselves. We’re a small team and don’t need even more infra to manage at this time.
And because we use ClickHouse, we didn’t need to fight with PromQL, an added bonus.
Fixing the OTel collector
Step one of the actual migration was transforming our OTel (Open Telemetry) data. We were, perhaps, a bit messy when initially defining attributes for our data sources. In Axoim, we could use a single virtual field to check all 4 variants of <inline-code>environment_id<inline-code>. That wouldn’t fly in ClickHouse’s typed JSON columns. We needed one canonical path per concept. (Claude initially struggled to migrate the queries because the data was a mess.)
So we tackled two big pieces of work: we migrated our attributes to follow OTel semantic conventions and normalized our attributes so we have a single source of truth for a given value.
OTel convention migration
We started by remapping our legacy OTel attribute names to current semantic conventions across 13 different categories such as network, HTTP, database, deployment, and exception.
It looked a little something like this:
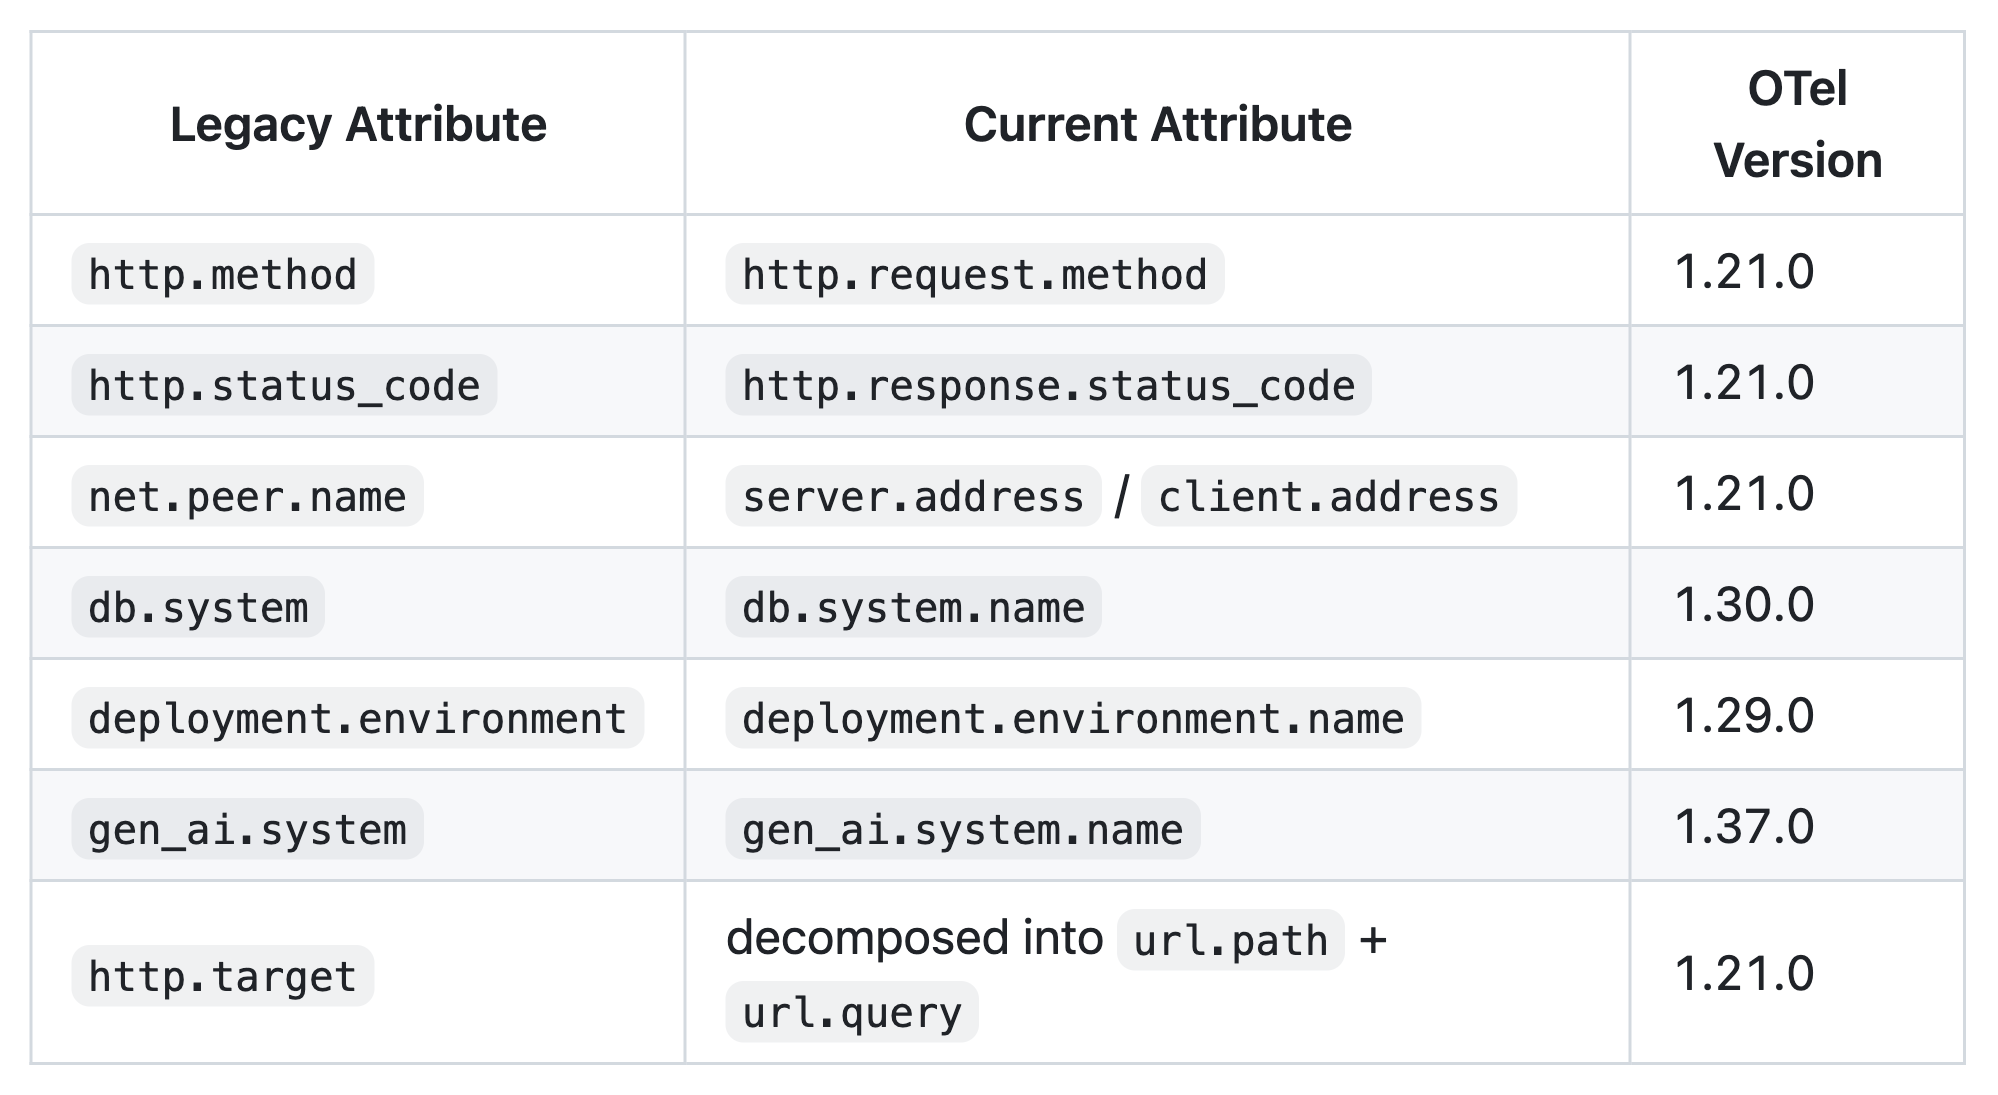
Standardized naming made it easier for agents and humans to understand our data streams during incidents.
Normalizing the attributes
Axoim allowed us to gracefully handle duplicate attributes. (Or maybe just ignore the duplicate attributes, gracefully.) It would be more difficult to filter and group at runtime on ClickHouse, so we normalized our attributes:
- <inline-code>environment_id<inline-code>, <inline-code>environmentId<inline-code>, <inline-code>billing.str.environment_id<inline-code>, <inline-code>function.tenant<inline-code> were all consolidated into <inline-code>gadget.environment_id<inline-code>
- <inline-code>application_id<inline-code>, <inline-code>applicationId<inline-code>, <inline-code>billing.str.application_id<inline-code> were all consolidated into <inline-code>gadget.application_id<inline-code>
We also split attributes into smaller segments using the OTTL (Open Telemetry Transformation Language) UserAgent function:
Example, <inline-code>url.full<inline-code> decomposed into <inline-code>url.domain<inline-code>, <inline-code>url.path<inline-code>, <inline-code>url.query<inline-code>, <inline-code>url.scheme<inline-code>, <inline-code>url.port<inline-code>, <inline-code>url.fragment<inline-code>
Claude wrote all of the transform logic, and we thoroughly reviewed and tested all changes.
# explode the user agent attribute
- context: span
  conditions:
    - attributes["user_agent.original"] != nil
  statements:
    - merge_maps(
        cache,
        UserAgent(attributes["user_agent.original"]),
        "upsert"
      )
    - set(
        attributes["user_agent.name"],
        cache["user_agent.name"]
      ) where
        attributes["user_agent.name"] == nil and
        cache["user_agent.name"] != nil
    - set(
        attributes["user_agent.version"],
        cache["user_agent.version"]
      ) where
        attributes["user_agent.version"] == nil and
        cache["user_agent.version"] != nil
    - set(
        attributes["user_agent.os.name"],
        cache["user_agent.os.name"]
      ) where
        attributes["user_agent.os.name"] == nil and
        cache["user_agent.os.name"] != nil
    - set(
        attributes["user_agent.os.version"],
        cache["user_agent.os.version"]
      ) where
        attributes["user_agent.os.version"] == nil and
        cache["user_agent.os.version"] != nil
That covered the work to clean up our tracing data, but we still had a couple more hurdles before we tackled the dashboards.
Another semi-related hurdle: forking Grafana’s ClickHouse plugin
But first, a final small detour.
ClickHouse provides these schemas for OTel tables. We decided to use JSON types for <inline-code>LogAttributes<inline-code>, <inline-code>SpanAttributes<inline-code>, and <inline-code>ResourceAttributes<inline-code> instead of the suggested <inline-code>Map(String, String)<inline-code> type, because of the feature-richness of the JSON type, including the ability to type-hint paths upfront and read JSON subpaths as separate columns.
But because the suggested format is <inline-code>Map(String, String)<inline-code>, Grafana’s ClickHouse plugin expects that format. So Yandu forked the Grafana plugin and updated it to support our JSON columns.
But what about the log data?
These same transformations had to be done on log data as well. We use a VRL script to do things like normalize log severity to consistent <inline-code>SeverityNumber<inline-code> and <inline-code>SeverityText<inline-code> pairs from a collection of integer codes, strings, and, as we like to so elegantly put it, “unknown” formats.
We also extract and parse service names, removing k8s suffixes, and do the same attribute normalization performed on the OTel collector. Deduplication was also required and we dropped 11 specific log messages also found in traces so the pipelines output totally unique data.
With the data attributes standardized and normalized (and more readable), we were ready to start building our dashboards in Grafana. The data transformation enabled us to use Claude to hammer through the next stages of the migration: migrating queries from Axiom’s APL to SQL, and building our dashboards.
Kirin: master of agent skills and rebuilding dashboards
The migrations could finally begin!
We didn’t just throw Claude at the problem right away. Scott manually ported the first dashboards: a subset of our operator central board and an inspector dashboard for individual k8s pods. Manually doing a first pass was useful. We learned how we want to structure our Grafana queries and the best query patterns for our use cases. (Kirin was able to port over our alert rules with the help of Claude and careful manual reviews and testing, while Scott worked on the first dashboard.)
And now that we had an initial pattern, we could unleash Claude. These Grafana dashboard definitions were pulled down and committed to source control. We created agent skills and rules that then referenced the examples.
Kirin set out to build an agent skill to help with the migrations. The original goal was to build a skill that speeds up migrations by running through the following high-level steps:
- Read existing Axoim dashboards
- Translate APL queries to SQL
- Execute queries against ClickHouse to verify correctness
- Update YAML files locally
- Push to Grafana and compare results
He used Claude and our manually built example (along with intimate knowledge about the shape of our data and pipeline) to build a collection of reference docs to assist us in the migration. This skill transformed into the foundation of our incident response procedure.
It also supercharged our dashboard migrations. Migration time dropped from 4 hours to 20 minutes per dashboard.
The biggest change to my workflow has been thinking of complex prompts that handle the whole task with all information up front. Including details like what to do, how to test it, and guidance on how to do it (although usually it is better than me at this part). That way, I can work on something else after. Going back and forth with an agent because you missed details earlier means that you are wasting time, and possibly bloating the context. If you can describe what to do succinctly, it will act more efficiently and correctly.
- Kirin Rastogi, Infrastructure Engineer @ Gadget
Claude yeets (carefully migrates) queries from APL to SQL
Translating APL to SQL would have been a horrible manual experience.
Once again, we were making use of Axoim’s virtual fields and stored query fragments to smooth over our disorganized data attributes, and now we need to translate those queries to read from ClickHouse.
(During the migration process, we ran the two observability stacks in parallel, then did a simple in-code switchover once we were confident that ClickHouse and Grafana were working properly.)
There were a couple of non-obvious translations that needed to happen, including migrating from APL’s <inline-code>extend<inline-code> and chained <inline-code>summarize<inline-code> map to nested SQL expressions. Here’s an example of this translation on one of our APL queries:
['core-tracing']
| where
    name == 'RunActivity:createAttemptAndRunBackgroundActionWithVisibility'
| extend
    scheduled_start = todatetime(
      ['attributes.custom']['background-action.next-attempt-starts-after']
    )
| extend
    actual_start = todatetime(
      ['attributes.custom']['background-action.start-date']
    )
| where
    datetime_diff("second", actual_start, scheduled_start) >= 0
| summarize
    value = percentile(
      datetime_diff("second", actual_start, scheduled_start),
      50
    ) by bin_auto(_time), environment_id
| summarize
    max(percentile(value, 90)) by bin_auto(_time)
Translated to SQL:
WITH
  extended AS (
    SELECT
      Timestamp,
      parseDateTimeBestEffort(
        SpanAttributes['background-action.next-attempt-starts-after']
      ) AS scheduled_start,
      parseDateTimeBestEffort(
        SpanAttributes['background-action.start-date']
      ) AS actual_start,
      toString(SpanAttributes['gadget.environment_id']) AS environment_id
    FROM otel.otel_traces_v2
    WHERE $__timeFilter(Timestamp)
      AND SpanName = 'RunActivity:createAttemptAndRunBackgroundActionWithVisibility'
  ),
  per_env AS (
    SELECT
      $__timeInterval(Timestamp) AS time,
      environment_id,
      quantile(0.5)(
        dateDiff('second', scheduled_start, actual_start)
      ) AS value
    FROM extended
    WHERE dateDiff('second', scheduled_start, actual_start) >= 0
    GROUP BY time, environment_id
  )
SELECT
  time,
  quantile(0.9)(value) AS value
FROM per_env
GROUP BY time
ORDER BY time
A game of spot-the-differences is pretty much just one big circle.
This is where agents were helpful. We could capture these transformation patterns repeated throughout our APL queries and use Claude to correctly and uniformly translate them to SQL queries.
Scott's pro tip: Grafana silently treats non-string <inline-code>GROUP BY<inline-code> columns as metric values instead of labels, which breaks visualizations. You'll stare at a graph wondering why all your series collapsed into one line, and the fix is wrapping the column in <inline-code>toString()<inline-code>.
- Scott Côté, Infrastructure Engineer @ Gadget
You can take a look at our since-removed-from-the-codebase-because-the-migration-is-complete skill in this gist. It contains common operator migrations from APL to SQL, and was incredibly useful for us (and for Claude).
Where we are now: AI-powered incident response
Claude handled the migration so well, so we leaned in. We invested time in building skills and testing existing MCP servers so agents can help us with production debugging and incident response.
In its current form, our <inline-code>/clickhouse<inline-code> skill now has:
- 28 best-practice rule files documenting topics like: primary key design, data types, partitioning, JSON usage, JOIN patterns, skipping indices, materialized views (incremental + refreshable), batch sizing, async inserts, mutation avoidance, and OPTIMIZE/FINAL avoidance.
- Namespace-specific schemas for our various services: gadget, sandbox, skipper, dateilager, and ingress-nginx, each with their own attribute reference and query examples. Each namespace schema documents which <inline-code>SpanName<inline-code> values exist, what <inline-code>LogAttributes<inline-code>/<inline-code>SpanAttributes<inline-code> paths are populated, and ready-to-run example queries.
- System diagnostics for OOM, cascade failures, and connection pileups. What are our current memory and query counts? Who in the system is traditionally a memory hog? All this, and much more, answerable by an agent.
- A core schema reference, documenting <inline-code>otel_logs_v1<inline-code> and <inline-code>otel_traces_v2<inline-code> column layouts and other key operational knowledge around query shape (<inline-code>toDateTime(Timestamp)<inline-code> is the PRIMARY KEY, putting it anywhere except first is 18-24x slower) and other restrictions (there is a 30-minute window limit on traces. It’s a big table, and wider windows reliably timeout).
- Instructions for running ClickHouse queries using our <inline-code>gadget-admin<inline-code> MCP server. The MCP server uses a read-only ClickHouse user granted a small quota of resources so that MCP requests don’t saturate the ClickHouse cluster.
And then there’s the 8-phase RCA investigation playbook. The playbook automates root-cause analysis for environment crashes and has become the entry point for incident response for unknown issues in production. It works through the following steps:
- Error timeline: Dig into the shape of the incident: when did errors start/peak/resolve?
- Traffic pattern: What's generating load: webhook flood, BGA backlog, or organic traffic?
- Rate limit analysis: Which rate limits were hit, which consumer classes?
- Database budget: Budget consumption at 10-second resolution, by model and operation type.
- Concurrency controller: PID controller behavior: crashing, oscillating, or stuck at 1?
- Traffic composition: Deep-dive into what's generating traffic, webhook amplification ratios, and pre/post-crash comparison.
- Error deep-dive: Timeout counts with span-layer deduplication (each timeout propagates through ~4 span layers, so divide by ~4 for unique count).
- Recovery Verification: Confirm intervention worked, non-background action traffic continuity, recon rate normalization, and background action traffic resumption.
An agent can use the skill to automate deep dives into incidents, saving us from manually traversing dashboards and walking through the same steps.
Here are some real-life examples of prompts we used to debug and resolve issues:
- /clickhouse why did the number of assignments by skipper controllers get so skewed such that 1 controller is assigning more functions than others -- this looks to have started around Mar 5, 2026, 9:00:00 PM EST
- /clickhouse why is this temporal workflow failing? Destructively-delete-app-313876
- /clickhouse figure out why these errors have gone off in the past hour: Remote procedure call failed: Timeout opening websocket connection to Gadget API
- /clickhouse go over all our ClickHouse tables in production and figure out which ones haven't received reads and/or writes in the past 7 days so we can clean them up.
We use the skill for debugging, incident response, to clean up unused infra... it’s a core piece of our daily workflow that just didn’t exist a couple of months ago.
Want to talk observability and incident response, or have questions about how we use agents? Gadget’s ops team is always hanging out in our developer Discord!
Thanks to Scott, Kirin, Yandu Oppacher, and the rest of the infrastructure team for contributing!